SAN MATEO, Calif.–(BUSINESS WIRE)–Upstart Holdings, Inc. (NASDAQ: UPST), a leading artificial intelligence (AI) lending marketplace, today announced preliminary unaudited financial results for the second quarter ending June 30, 2022. Upstart also announced that its final second quarter fiscal year 2022 business and financial results will be released on Monday, August 8, 2022 after the market close.
Second Quarter 2022 Preliminary Unaudited Financial Results:
Revenue is expected to be approximately $228 million, previously guided at $295 to $305 million
Contribution margin is expected to be approximately 47{ac23b82de22bd478cde2a3afa9e55fd5f696f5668b46466ac4c8be2ee1b69550}, previously guided at approximately 45{ac23b82de22bd478cde2a3afa9e55fd5f696f5668b46466ac4c8be2ee1b69550}
Net Income (loss) is expected to be in the range of ($31)-($27) million, previously guided at ($4) to $0 million
“Inflation and recession fears have driven interest rates up and put banks and capital markets on cautious footing,” said Dave Girouard, co-founder and CEO of Upstart. “Our revenue was negatively impacted by two factors approximately equally. First, our marketplace is funding constrained, largely driven by concerns about the macroeconomy among lenders and capital market participants. Second, in Q2, we took action to convert loans on our balance sheet into cash, which, given the quickly increasing rate environment, negatively impacted our revenue.”
“During the second quarter, we improved our unit economics and oriented ourselves toward continued positive cash flow even at lower loan origination volumes. With a low fixed cost base, we expect to continue adding to our almost $800 million unrestricted cash balance as well as to continue repurchasing Upstart shares as it makes sense. And finally, despite limiting hiring to critical areas, we continue to invest in our models and products and are confident Upstart will emerge from this cycle a stronger company.”
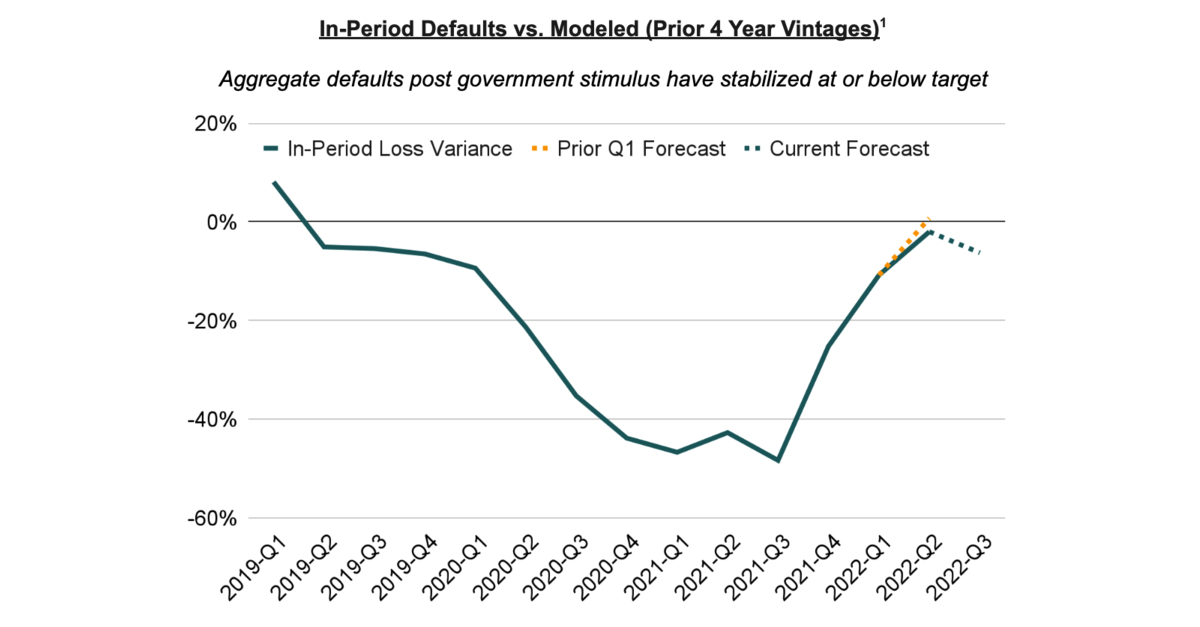
Sanjay Datta, CFO of Upstart, said “Despite the tumultuous economy, Upstart-powered loans have performed exceptionally well. For loans facilitated through our platform and held by our more than 60 bank and credit union partners, average returns have consistently met or exceeded expectations since the program’s inception in 2018.”
“For loans purchased by non-bank institutions, all vintages from 2018 thorough 2020 delivered significant excess returns, while our 2021 vintage is within 100 basis points of our loss expectations. Lastly, we believe our models are well calibrated to economic conditions and are currently targeting returns in excess of 10 percent.”
Conference Call:
Upstart will host a conference call and live webcast August 8th, 2022 at 1:30 p.m. PT / 4:30 p.m. ET. Prior to the conference call, the second quarter 2022 earnings press release with final financial results and an investor presentation will be available on Upstart’s investor relations website at ir.upstart.com.
Live webcast. The live webcast will be accessible on Upstart’s investor relations website, ir.upstart.com, and an archived webcast of the conference call will be available after the conference call.
Conference Call Dial In. To access the live conference call in the United States and Canada: +1 800-289-0720, conference code 2205299. To access the live conference call outside of the United States and Canada: +1 313-209-5140, conference code 2205299.
Financial Disclosure Advisory
Upstart has not yet completed its reporting process for its second quarter 2022 ended June 30, 2022. The preliminary results presented herein are approximate and based on its reasonable estimates and the information available to it at this time and, because of their preliminary nature, in certain cases, Upstart has provided ranges, rather than specific amounts. As such, Upstart’s actual results may materially vary from the preliminary results presented herein and will not be finalized until Upstart reports its final results for its second quarter 2022 after the completion of its normal quarter-end accounting procedures, including the execution of its internal controls over financial reporting. In addition, any statements regarding Upstart’s estimated financial performance for the second quarter 2022 do not present all information necessary for an understanding of Upstart’s financial condition and results of operations as of and for the quarterly period ended June 30, 2022.
About Upstart
Upstart is a leading AI lending marketplace partnering with banks and credit unions to expand access to affordable credit. By leveraging Upstart’s AI platform, Upstart-powered banks and credit unions can have higher approval rates and lower loss rates for every race, ethnicity, age, and gender, while simultaneously delivering the exceptional digital-first lending experience their customers demand. More than two-thirds of Upstart loans are approved instantly and are fully automated. Upstart was founded by ex-Googlers in 2012 and is based in San Mateo, California and Columbus, Ohio.
Forward-Looking Statements
This press release contains forward-looking statements. You can identify forward-looking statements by the fact that they do not relate strictly to historical or current facts. These statements may include words such as “anticipate”, “estimate”, “expect”, “project”, “plan”, “intend”, “target”, “aim”, “believe”, “may”, “will”, “should”, “becoming”, “could”, “can have”, “likely” and other words and terms of similar meaning in connection with any discussion of the timing or nature of future operating or financial performance or other events. Forward-looking statements give our current expectations and projections relating to our financial condition; macroeconomic factors; plans; objectives; product development; growth opportunities; assumptions; risks; future performance; default rates on loans; business; any investments; and results of operations, including revenue, contribution margin and net income (loss). Neither we nor any other person assumes responsibility for the accuracy and completeness of any of these forward-looking statements. The forward-looking statements included in this press release relate only to events as of the date hereof. Upstart undertakes no obligation to update or revise any forward-looking statement as a result of new information, future events or otherwise, except as otherwise required by law.
All forward-looking statements are subject to risks and uncertainties that may cause actual results to differ materially from those that we expected. More information about factors that could affect our results of operations and risks and uncertainties are provided in our public filings with the Securities and Exchange Commission, copies of which may be obtained by visiting our investor relations website at www.upstart.com or the SEC’s website at www.sec.gov. These risks and uncertainties include, but are not limited to, our ability to sustain our growth rates; the effectiveness of our credit decisioning models and risk management efforts; overall economic conditions, particularly interest rates; geopolitical events, such as the Russia-Ukraine conflict; disruptions in the credit markets; our ability to retain existing, and attract new, bank partners and lenders; and our ability to operate successfully in a highly-regulated industry.
About Non-GAAP Financial Measures
In addition to our results determined in accordance with generally accepted accounting principles in the United States (“GAAP”), we believe the non-GAAP measure of contribution margin is useful in evaluating our operating performance.
We believe non-GAAP information is useful in evaluating the operating results, ongoing operations, and for internal planning and forecasting purposes. We also believe that non-GAAP financial measures provide consistency and comparability with past financial performance and assist investors with comparing Upstart to other companies, some of which use similar non-GAAP financial measures to supplement their GAAP results. Non-GAAP financial measures are presented for supplemental informational purposes only and should not be considered a substitute for financial information presented in accordance with GAAP and may be different from similarly titled non-GAAP financial measures used by other companies.
Reconciliation tables of the most comparable GAAP financial measures to the non-GAAP financial measure used in this press release are included below.
UPSTART HOLDINGS, INC.
RECONCILIATION OF GAAP TO NON-GAAP FINANCIAL MEASURES
Borrower acquisition costs are expected to be 36{ac23b82de22bd478cde2a3afa9e55fd5f696f5668b46466ac4c8be2ee1b69550} of Revenue from fees, net for the three months ended June 30, 2022. Borrower acquisition costs consist of our sales and marketing expenses adjusted to exclude costs not directly attributable to attracting a new borrower, such as payroll-related expenses for our business development and marketing teams, as well as other operational, brand awareness and marketing activities.
Borrower verification and servicing costs are expected to be 17{ac23b82de22bd478cde2a3afa9e55fd5f696f5668b46466ac4c8be2ee1b69550} of Revenue from fees, net for the three months ended June 30, 2022. Borrower verification and servicing costs consist of payroll and other personnel-related expenses for personnel engaged in loan onboarding, verification and servicing, as well as servicing system costs. It excludes payroll and personnel-related expenses and stock-based compensation for certain members of our customer operations team whose work is not directly attributable to onboarding and servicing loans.
BEIJING, Could 13, 2022 /PRNewswire/ — Initially Superior-College Education and learning Group Co., Ltd. (“1st Higher-University Instruction Group” or the “Organization”) (NYSE: FHS), an training provider company generally concentrating on high schools in Western China, now announced that it will launch its unaudited monetary benefits for the initially quarter 2022 ended March 31, 2022, prior to U.S. markets open on May 17, 2022.
1st Large-Faculty Education Group’s management will keep an earnings conference get in touch with on Wednesday, May possibly 18, 2022, at 8:00 AM U.S. Eastern Time (8:00 PMCould 18, 2022, Beijing/Hong Kong Time). Remember to dial in 15 minutes before the conference is scheduled to begin employing below numbers.
Intercontinental
1-412-317-6061
United States
1-888-317-6003
Hong Kong
800-963976
Mainland China
4001-206115
Passcode
7478244
A phone replay of the convention call may be accessed by cellphone at the following figures until finally May perhaps 25, 2022.
Worldwide
1-412-317-0088
United States
1-877-344-7529
Replay Accessibility Code
2433115
A are living and archived webcast of the meeting phone will be available on the company’s investors relations internet site at https://ir.diyi.best/.
About To start with Large-Faculty Instruction Group
To start with Significant-School Training Team is an education assistance company principally focusing on high educational facilities in Western China. The Firm aspires to come to be a chief and innovator of non-public high faculty schooling in China, with the focuses on a thorough education and learning administration integrating schooling details consulting, training exploration job enhancement, instruction talent administration, schooling technological know-how administration, schooling company administration, and general vocational integration development services. For much more details, make sure you visit https://ir.diyi.best/.
Forward-Seeking Statements
Statements in this press launch about upcoming anticipations, designs and prospective buyers, as effectively as any other statements relating to matters that are not historical points, may possibly represent “forward-seeking statements” in the meaning of Part 21E of the Securities Exchange Act of 1934, as amended, and as outlined in the U.S. Personal Securities Litigation Reform Act of 1995. These statements include things like, but are not limited to, statements relating to the envisioned investing commencement and closing dates. The words “foresee,” “think,” “proceed,” “could,” “estimate,” “assume,” “intend,” “might,” “plan,” “potential,” “predict,” “challenge,” “should,” “target,” “will,” “would” and comparable expressions are supposed to detect ahead-on the lookout statements, despite the fact that not all forward-on the lookout statements comprise these identifying words and phrases. Real effects may perhaps vary materially from all those indicated by these types of forward-searching statements as a outcome of various vital variables, together with: the uncertainties linked to sector circumstances and the completion of the public featuring on the anticipated terms or at all, and other factors discussed in the “Danger Variables” segment of the preliminary prospectus filed with the SEC. Any forward-on the lookout statements contained in this press launch speak only as of the day hereof, and the Company especially disclaims any obligation to update any forward-searching statement, irrespective of whether as a end result of new info, foreseeable future occasions or usually.
For Trader and Media Inquiries Be sure to Call:
1st High-University Training Team Tommy Zhou Main Fiscal Officer E-mail: tommyzhou@dygz.com
Shopper Support E-mail: FHS_facts@dygz.com Cellular phone: 010-62555966 (9:30-12:00, 13:30-16:00 CST)
BEIJING, Feb. 21, 2022 /PRNewswire/ — TAL Education Group (NYSE: TAL) (“TAL” or the “Company”), a smart learning solutions provider in China, today announced its unaudited financial results for the third quarter of fiscal year 2022 ended November 30, 2021.
Highlights for the Third Quarter of Fiscal Year 2022
Net revenues decreased by 8.8{ac23b82de22bd478cde2a3afa9e55fd5f696f5668b46466ac4c8be2ee1b69550} year-over-year to US$1,020.9 million from US$1,119.1 million in the same period of the prior year.
Loss from operations was US$108.4 million, compared to loss from operations of US$127.4 million in the same period of the prior year.
Non-GAAP loss from operations, which excluded share-based compensation expenses, was US$67.6 million, compared to non-GAAP loss from operations of US$73.4 million in the same period of the prior year.
Net loss attributable to TAL was US$99.4 million, compared to net loss attributable to TAL of US$43.6 million in the same period of the prior year.
Non-GAAP net loss attributable to TAL, which excluded share-based compensation expenses, was US$58.6 million, compared to non-GAAP net income attributable to TAL of US$10.4 million in the same period of the prior year.
Basic and diluted net loss per American Depositary Share (“ADS”) were both US$0.15. Non-GAAP basic and diluted net loss per ADS, which excluded share-based compensation expenses, were both US$0.09. Three ADSs represent one Class A common share.
Cash, cash equivalents and short-term investments totaled US$2,837.2 million as of November 30, 2021, compared to US$5,937.5 million as of February 28, 2021.
Highlights for the Nine Months Ended November 30, 2021
Net revenues increased by 22.9{ac23b82de22bd478cde2a3afa9e55fd5f696f5668b46466ac4c8be2ee1b69550} year-over-year to US$3,849.8 million from US$3,133.1 million in the same period of the prior year.
Loss from operations was US$615.2 million, compared to loss from operations of US$141.0 million in the same period of the prior year.
Non-GAAP loss from operations, which excluded share-based compensation expenses, was US$440.5 million, compared to non-GAAP loss from operations of US$16.4 million in the same period of the prior year.
Net loss attributable to TAL was US$1,028.0 million, compared to net income attributable to TAL of US$53.0 million in the same period of the prior year.
Non-GAAP net loss attributable to TAL, which excluded share-based compensation expenses, was US$853.3 million, compared to non-GAAP net income attributable to TAL of US$177.6 million in the same period of the prior year.
Basic and diluted net loss per ADS were both US$1.60. Non-GAAP basic and diluted net loss per ADS, excluding share-based compensation expenses, were both US$1.33.
Financial Data——Third Quarter and First Nine Months of Fiscal Year 2022
(In US$ thousands, except per ADS data and percentages)
Financial Results for the Third Quarter of Fiscal Year 2022
Net Revenues
In the third quarter of fiscal year 2022, TAL reported net revenues of US$1,020.9 million, representing an 8.8{ac23b82de22bd478cde2a3afa9e55fd5f696f5668b46466ac4c8be2ee1b69550} decrease from US$1,119.1 million in the third quarter of fiscal year 2021.
Operating Costs and Expenses
In the third quarter of fiscal year 2022, operating costs and expenses were US$1,139.3 million, representing a 9.3{ac23b82de22bd478cde2a3afa9e55fd5f696f5668b46466ac4c8be2ee1b69550} decrease from US$1,255.9 million in the third quarter of fiscal year 2021. Non-GAAP operating costs and expenses, which excluded share-based compensation expenses, were US$1,098.5 million, representing an 8.6{ac23b82de22bd478cde2a3afa9e55fd5f696f5668b46466ac4c8be2ee1b69550} decrease from US$1,201.8 million in the third quarter of fiscal year 2021.
Cost of revenues increase by 0.8{ac23b82de22bd478cde2a3afa9e55fd5f696f5668b46466ac4c8be2ee1b69550} to US$519.5 million from US$516.0 million in the third quarter of fiscal year 2021. Non-GAAP cost of revenues, which excluded share-based compensation expenses, increase by 0.8{ac23b82de22bd478cde2a3afa9e55fd5f696f5668b46466ac4c8be2ee1b69550} to US$519.2 million, from US$515.2 million in the third quarter of fiscal year 2021.
Selling and marketing expenses decreased by 35.0{ac23b82de22bd478cde2a3afa9e55fd5f696f5668b46466ac4c8be2ee1b69550} to US$273.6 million from US$420.7 million in the third quarter of fiscal year 2021. Non-GAAP selling and marketing expenses, which excluded share-based compensation expenses, decreased by 36.4{ac23b82de22bd478cde2a3afa9e55fd5f696f5668b46466ac4c8be2ee1b69550} to US$258.6 million, from US$406.4 million in the third quarter of fiscal year 2021.
General and administrative expenses increased by 5.7{ac23b82de22bd478cde2a3afa9e55fd5f696f5668b46466ac4c8be2ee1b69550} to US$300.0 million from US$283.8 million in the third quarter of fiscal year 2021. Non-GAAP general and administrative expenses, which excluded share-based compensation expenses, increased by 12.2{ac23b82de22bd478cde2a3afa9e55fd5f696f5668b46466ac4c8be2ee1b69550} to US$274.4 million, from US$244.5 million in the third quarter of fiscal year 2021.
Total share-based compensation expenses allocated to the related operating costs and expenses decreased by 24.5{ac23b82de22bd478cde2a3afa9e55fd5f696f5668b46466ac4c8be2ee1b69550} to US$40.8 million in the third quarter of fiscal year 2022 from US$54.0 million in the same period of fiscal year 2021.
Impairment loss on intangible assets and goodwill was $46.2 million for the third quarter of fiscal year 2022, compared to US$35.7 million for the third quarter of fiscal year 2021.
Gross Profit
Gross profit decreased by 16.9{ac23b82de22bd478cde2a3afa9e55fd5f696f5668b46466ac4c8be2ee1b69550} to US$501.4 million from US$603.6 million in the third quarter of fiscal year 2021.
Loss from Operations
Loss from operations was US$108.4 million in the third quarter of fiscal year 2022, compared to loss from operations of US$127.4 million in the third quarter of fiscal year 2021. Non-GAAP loss from operations was US$67.6 million, compared to Non-GAAP loss from operations of US$73.4 million in the same period of the prior year.
Other Income
Other income was US$9.5 million for the third quarter of fiscal year 2022, compared to other income of US$45.5 million in the third quarter of fiscal year 2021.
Impairment Loss on Long-term Investments
Impairment loss on long-term investments was nil for the third quarter of fiscal year 2022, compared to US$11.5 million for the third quarter of fiscal year 2021.
Income Tax Benefit/(expense)
Income tax expense was US$25.6 million in the third quarter of fiscal year 2022, compared to US$13.9 million of income tax benefit in the third quarter of fiscal year 2021.
Net Loss/(income) Attributable to TAL Education Group
Net loss attributable to TAL was US$99.4 million in the third quarter of fiscal year 2022, compared to net loss attributable to TAL of US$43.6 million in the third quarter of fiscal year 2021. Non-GAAP net loss attributable to TAL, which excluded share-based compensation expenses, was US$58.6 million, compared to Non-GAAP net income attributable to TAL of US$10.4 million in the third quarter of fiscal year 2021.
Basic and Diluted Net Loss per ADS
Basic and diluted net loss per ADS were both US$0.15 in the third quarter of fiscal year 2022. Non-GAAP basic and diluted net loss per ADS, which excluded share-based compensation expenses, were both US$0.09, in the third quarter of fiscal year 2022.
Cash, Cash Equivalents, and Short-Term Investments
As of November 30, 2021, the Company had US$1,347.9 million of cash and cash equivalents and US$1,489.3 million of short-term investments, compared to US$3,243.0 million of cash and cash equivalents and US$2,694.5 million of short-term investments as of February 28, 2021.
Financial Results for the First Nine Months of Fiscal Year 2022
Net Revenues
For the first nine months of fiscal year 2022, TAL reported net revenues of US$3,849.8 million, representing a 22.9{ac23b82de22bd478cde2a3afa9e55fd5f696f5668b46466ac4c8be2ee1b69550} increase from US$3,133.1 million in the first nine months of fiscal year 2021.
Operating Costs and Expenses
In the first nine months of fiscal year 2022, operating costs and expenses were US$4,480.0 million, a 36.1{ac23b82de22bd478cde2a3afa9e55fd5f696f5668b46466ac4c8be2ee1b69550} increase from US$3,291.5 million in the first nine months of fiscal year 2021. Non-GAAP operating costs and expenses, which excluded share-based compensation expenses, were US$4,305.3 million, a 35.9{ac23b82de22bd478cde2a3afa9e55fd5f696f5668b46466ac4c8be2ee1b69550} increase from US$3,166.9 million in the first nine months of fiscal year 2021.
Cost of revenues increased by 36.7{ac23b82de22bd478cde2a3afa9e55fd5f696f5668b46466ac4c8be2ee1b69550} to US$2,005.3 million from US$1,467.1 million in the first nine months of fiscal year 2021. Non-GAAP cost of revenues, which excluded share-based compensation expenses, increased by 36.7{ac23b82de22bd478cde2a3afa9e55fd5f696f5668b46466ac4c8be2ee1b69550} to US$2,004.3 million from US$1,466.0 million in the first nine months of fiscal year 2021.
Selling and marketing expenses decreased by 0.5{ac23b82de22bd478cde2a3afa9e55fd5f696f5668b46466ac4c8be2ee1b69550} to US$1,014.7 million from US$1,019.6 million in the first nine months of fiscal year 2021. Non-GAAP selling and marketing expenses, which excluded share-based compensation expenses, decreased by 3.7{ac23b82de22bd478cde2a3afa9e55fd5f696f5668b46466ac4c8be2ee1b69550} to US$951.2 million from US$988.0 million in the first nine months of fiscal year 2021.
General and administrative expenses increased by 28.5{ac23b82de22bd478cde2a3afa9e55fd5f696f5668b46466ac4c8be2ee1b69550} to US$987.6 million from US$768.7 million in the first nine months of fiscal year 2021. Non-GAAP general and administrative expenses, which excluded share-based compensation expenses, increased by 29.6{ac23b82de22bd478cde2a3afa9e55fd5f696f5668b46466ac4c8be2ee1b69550} to US$877.3 million from US$676.9 million in the first nine months of fiscal year 2021.
Total share-based compensation expenses allocated to the related operating costs and expenses increased by 40.2{ac23b82de22bd478cde2a3afa9e55fd5f696f5668b46466ac4c8be2ee1b69550} to US$174.7 million in the first nine months of fiscal year 2022 from US$124.6 million in the same period of fiscal year 2021.
Impairment loss on intangible assets and goodwill was US$472.4 million for the first nine months of fiscal year 2022, compared to US$36.0 million for the same period of fiscal year 2021.
Gross Profit
Gross profit grew by 10.7{ac23b82de22bd478cde2a3afa9e55fd5f696f5668b46466ac4c8be2ee1b69550} to US$1,844.5 million from US$1,666.0 million in the first nine months of fiscal year 2021.
Loss from Operations
Loss from operations was US$615.2 million in the first nine months of fiscal year 2022, compared to loss from operations of US$141.0 million in the same period of the prior year. Non-GAAP loss from operations, which excluded share-based compensation expenses, was US$440.5 million for the first nine months of fiscal year 2022, compared to non-GAAP loss from operations, which excluded share-based compensation expenses, was US$16.4 million in the first nine months of fiscal year 2021.
Other Income
Other income was US$17.6 million for the first nine months of fiscal year 2022, compared to other income of US$132.9 million for the first nine months of fiscal year 2021.
Impairment Loss on Long-term Investments
Impairment loss on long-term investments was US$178.1 million for the first nine months of fiscal year 2022, compared to US$18.4 million for the first nine months of fiscal year 2021.
Income Tax Expense
Income tax expense was US$367.1 million in the first nine months of fiscal year 2022, compared to US$10.6 million of income tax expense in the first nine months of fiscal year 2021.
Net Loss/(income) Attributable to TAL Education Group
Net loss attributable to TAL was US$1,028.0 million in the first nine months of fiscal year 2022, compared to net income attributable to TAL of US$53.0 million in the first nine months of fiscal year 2021. Non-GAAP net loss attributable to TAL, which excluded share-based compensation expenses, was US$853.3 million in the first nine months of fiscal year 2022, compared to Non-GAAP net income attributable to TAL, which excluded share-based compensation expenses, was US$177.6 million in the first nine months of fiscal year 2021.
Basic and Diluted Net Loss per ADS
Basic and diluted net loss per ADS were both US$1.60, in the first nine months of fiscal year 2022. Non-GAAP basic and Non-GAAP diluted net loss per ADS, which excluded share-based compensation expenses, were both US$1.33, in the first nine months of fiscal year 2022.
Recent Development
On November 12, 2021, the Company issued a press release to announce that in response to the regulatory developments relating to after-school tutoring services, including the Opinions on Further Alleviating the Burden of Homework and After-School Tutoring for Students in Compulsory Education, published in July 2021 by the General Office of the CPC Central Committee and the General Office of the State Council (the “Opinion”) and the related implementation rules, regulations and measures promulgated by competent authorities, the Company decided to cease offering academic subjects to students from kindergarten through grade nine (“K9 Academic AST Services”) in the mainland of China by the end of December 2021.
The Company has completed the cessation by the due date and expects that the cessation will have a substantial adverse impact on the Company’s revenues for the fiscal year ending February 28, 2022 and subsequent periods. In the fiscal year ended February 28, 2021, the revenues from offering K9 Academic AST Services accounted for a substantial majority of the Company’s total revenues in the year. Therefore, the Company believes that the financial results for the fiscal periods ended November 30, 2021 would not be indicative for its performance going forward.
By leveraging its leading-edge education technology, high quality content and extensive experience, the Company will continue to operate and develop the portion of its business other than K9 Academic AST Services, and will also explore other opportunities to provide learning solutions in accordance with relevant rules and regulations.
The Company will continue to seek guidance from and cooperate with government authorities in various provinces and municipalities in China in connection with its efforts to comply with the policy directives in the Opinion and any related implementation rules, regulations and measures. The Company will further adjust its business operations as required, and provide updates to its shareholders as appropriate.
Safe Harbor Statement
This announcement contains forward-looking statements. These statements are made under the “safe harbor” provisions of the U.S. Private Securities Litigation Reform Act of 1995. These forward-looking statements can be identified by terminology such as “will,” “expects,” “anticipates,” “future,” “intends,” “plans,” “believes,” “estimates” and similar statements. Among other things, TAL Education Group’s strategic and operational plans contain forward-looking statements. The Company may also make written or oral forward-looking statements in its reports filed with, or furnished to, the U.S. Securities and Exchange Commission, in its annual reports to shareholders, in press releases and other written materials and in oral statements made by its officers, directors or employees to third parties. Statements that are not historical facts, including statements about the Company’s beliefs and expectations, are forward-looking statements. Forward-looking statements involve inherent risks and uncertainties. A number of factors could cause actual results to differ materially from those contained in any forward-looking statement, including but not limited to the following: the Company’s ability to continue to provide competitive learning services and products; the Company’s ability to continue to recruit, train and retain talents; the Company’s ability to improve the content of current course offerings and develop new courses; the Company’s ability to maintain and enhance its brand; the Company’s ability to maintain and continue to improve its teaching results; and the Company’s ability to compete effectively against its competitors. Further information regarding these and other risks is included in the Company’s reports filed with, or furnished to the U.S. Securities and Exchange Commission. All information provided in this press release and in the attachments is as of the date of this press release, and TAL Education Group undertakes no duty to update such information or any forward-looking statement, except as required under applicable law.
About TAL Education Group
TAL Education Group is a smart learning solutions provider in China. The acronym “TAL” stands for “Tomorrow Advancing Life”, which reflects our vision to promote top learning opportunities for students through both high-quality teaching and content, as well as leading edge application of technology in the education experience. TAL Education Group offers comprehensive learning services to students from pre-school to the twelfth grade primarily through three flexible class formats: small classes, personalized premium services, and online courses. Our learning services mainly cover enrichment learnings programs and some academic subjects in and out of China. Our ADSs trade on the New York Stock Exchange under the symbol “TAL”.
About Non-GAAP Financial Measures
In evaluating its business, TAL considers and uses the following measures defined as non-GAAP financial measures by the SEC as supplemental metrics to review and assess its operating performance: non-GAAP operating costs and expenses, non-GAAP cost of revenues, non-GAAP selling and marketing expenses, non-GAAP general and administrative expenses, non-GAAP income from operations, non-GAAP net income attributable to TAL, non-GAAP basic and non-GAAP diluted net income per ADS. To present each of these non-GAAP measures, the Company excludes share-based compensation expenses. The presentation of these non-GAAP financial measures is not intended to be considered in isolation or as a substitute for the financial information prepared and presented in accordance with GAAP. For more information on these non-GAAP financial measures, please see the table captioned “Reconciliations of non-GAAP measures to the most comparable GAAP measures” set forth at the end of this release.
TAL believes that these non-GAAP financial measures provide meaningful supplemental information regarding its performance and liquidity by excluding share-based expenses that may not be indicative of its operating performance from a cash perspective. TAL believes that both management and investors benefit from these non-GAAP financial measures in assessing its performance and when planning and forecasting future periods. These non-GAAP financial measures also facilitate management’s internal comparisons to TAL’s historical performance and liquidity. TAL computes its non-GAAP financial measures using the same consistent method from quarter to quarter and from period to period. TAL believes these non-GAAP financial measures are useful to investors in allowing for greater transparency with respect to supplemental information used by management in its financial and operational decision making. A limitation of using non-GAAP measures is that these non-GAAP measures exclude share-based compensation charges that have been and will continue to be for the foreseeable future a significant recurring expense in the Company’s business. Management compensates for these limitations by providing specific information regarding the GAAP amounts excluded from each non-GAAP measure. The accompanying tables have more details on the reconciliations between GAAP financial measures that are most directly comparable to non-GAAP financial measures.
TAL EDUCATION GROUP
UNAUDITED CONDENSED CONSOLIDATED BALANCE SHEETS
(In thousands of U.S. dollars)
As of
February 28, 2021
As of
November 30, 2021
ASSETS
Current assets
Cash and cash equivalents
$ 3,242,953
$ 1,347,934
Restricted cash-current
1,758,937
1,110,112
Short-term investments
2,694,555
1,489,245
Inventory
38,675
22,239
Amounts due from related parties-current
2,964
2,093
Income tax receivables
15,641
20,926
Prepaid expenses and other current assets
403,110
178,349
Total current assets
8,156,835
4,170,898
Restricted cash-non-current
16,094
377,898
Property and equipment, net
511,415
358,914
Deferred tax assets
317,189
8,524
Rental deposits
102,555
94,234
Intangible assets, net
66,041
16,776
Land use right, net
216,702
216,942
Goodwill
454,413
18,836
Amounts due from related parties- non-current
–
63
Long-term investments
667,636
557,974
Long-term prepayments and other non-current assets
57,694
19,943
Operating lease right-of-use assets
1,545,735
828,980
Total assets
$ 12,112,309
$ 6,669,982
LIABILITIES AND EQUITY
Current liabilities
Accounts payable
$ 353,778
$ 150,867
Deferred revenue-current
1,387,493
538,979
Amounts due to related parties-current
3,488
312
Accrued expenses and other current liabilities
911,283
928,463
Income tax payable
65,138
33,297
Current portion of long-term debt
270,000
–
Operating lease liabilities, current portion
382,671
247,344
Total current liabilities
3,373,851
1,899,262
Deferred revenue-non-current
30,005
20
Deferred tax liabilities
10,333
17,898
Bond payable
2,300,000
–
Operating lease liabilities, non-current portion
1,193,564
634,295
Total liabilities
6,907,753
2,551,475
Mezzanine equity
Redeemable non-controlling interests
1,775
–
Equity
Class A common shares
148
166
Class B common shares
67
49
Additional paid-in capital
4,369,125
4,358,131
Statutory reserve
121,285
111,151
Retained earnings/(accumulated deficit)
624,883
(392,975)
Accumulated other comprehensive income
86,321
68,888
Total TAL Education Group’s equity
5,201,829
4,145,410
Noncontrolling interest
952
(26,903)
Total equity
5,202,781
4,118,507
Total liabilities, mezzanine equity and equity
$ 12,112,309
$ 6,669,982
TAL EDUCATION GROUP
UNAUDITED CONDENSED CONSOLIDATED STATEMENTS OF OPERATIONS
(In thousands of U.S. dollars, except share, ADS, per share and per ADS data)
For the Three Months Ended November 30,
For the Nine Months Ended November 30,
2020
2021
2020
2021
Net revenues
$ 1,119,135
$ 1,020,932
$ 3,133,066
$ 3,849,755
Cost of revenues (note 1)
515,560
519,483
1,467,112
2,005,252
Gross profit
603,575
501,449
1,665,954
1,844,503
Operating expenses (note 1)
Selling and marketing
420,747
273,629
1,019,598
1,014,666
General and administrative
283,827
299,963
768,719
987,595
Impairment loss on intangible assets and goodwill
35,727
46,247
36,031
472,437
Total operating expenses
740,301
619,839
1,824,348
2,474,698
Government subsidies
9,337
9,961
17,380
15,035
Loss from operations
(127,389)
(108,429)
(141,014)
(615,160)
Interest income
28,879
12,747
79,065
84,644
Interest expense
(2,714)
(1,821)
(9,378)
(7,871)
Other income
45,507
9,520
132,948
17,611
Impairment loss on long-term investments
(11,472)
–
(18,357)
(178,063)
(Loss)/income before provision for income tax and income from equity method investments
(67,189)
(87,983)
43,264
(698,839)
Income tax benefit/(expense)
13,887
(25,562)
(10,556)
(367,120)
Income from equity method investments
411
6,423
6,352
10,471
Net (loss)/income
(52,891)
(107,122)
39,060
(1,055,488)
Add: Net loss attributable to noncontrolling interest
9,283
7,754
13,952
27,496
Total net (loss)/income attributable to TAL Education Group
$ (43,608)
$ (99,368)
$ 53,012
$ (1,027,992)
Net (loss)/income per common share
Basic
$ (0.22)
$ (0.46)
$ 0.26
$ (4.79)
Diluted
(0.22)
(0.46)
0.25
(4.79)
Net (loss)/income per ADS (note 2)
Basic
$ (0.07)
$ (0.15)
$ 0.09
$ (1.60)
Diluted
(0.07)
(0.15)
0.08
(1.60)
Weighted average shares used in calculating net (loss)/income per common share
Basic
202,039,751
214,672,624
200,786,811
214,619,651
Diluted
202,039,751
214,672,624
208,710,216
214,619,651
Note1: Share-based compensation expenses are included in the operating costs and expenses as follows:
For the Three Months
For the Nine Months
Ended November 30,
Ended November 30,
2020
2021
2020
2021
Cost of revenues
$ 404
$ 262
$ 1,158
$ 996
Selling and marketing expenses
14,322
15,008
31,644
63,440
General and administrative expenses
39,309
25,548
91,805
110,261
Total
$ 54,035
$ 40,818
$ 124,607
$ 174,697
Note 2: Three ADSs represent one Class A common Share.
TAL EDUCATION GROUP
UNAUDITED CONDENSED CONSOLIDATED STATEMENTS OF
COMPREHENSIVE INCOME/(LOSS)
(In thousands of U.S. dollars)
For the Three Months Ended
November 30,
For the Nine Months Ended
November 30,
2020
2021
2020
2021
Net (loss)/income
$ (52,891)
$ (107,122)
$ 39,060
$ (1,055,488)
Other comprehensive income/(loss), net of tax
54,944
6,053
87,834
(17,796)
Comprehensive income/(loss)
2,053
(101,069)
126,894
(1,073,284)
Add: Comprehensive loss attributable to noncontrolling interest
8,581
8,106
12,872
27,855
Comprehensive income/(loss) attributable to TAL Education Group
$ 10,634
$ (92,963)
$ 139,766
$ (1,045,429)
TAL EDUCATION GROUP
Reconciliation of Non-GAAP Measures to the Most Comparable GAAP Measures
(In thousands of U.S. dollars, except share, ADS, per share and per ADS data)
For the Three Months
Ended November 30,
For the Nine Months Ended November 30,
2020
2021
2020
2021
Cost of revenues
$ 515,560
$ 519,483
$ 1,467,112
$ 2,005,252
Share-based compensation expense in cost of revenues
404
262
1,158
996
Non-GAAP cost of revenues
515,156
519,221
1,465,954
2,004,256
Selling and marketing expenses
420,747
273,629
1,019,598
1,014,666
Share-based compensation expense in selling and marketing expenses
14,322
15,008
31,644
63,440
Non-GAAP selling and marketing expenses
406,425
258,621
987,954
951,226
General and administrative expenses
283,827
299,963
768,719
987,595
Share-based compensation expense in general and administrative expenses
39,309
25,548
91,805
110,261
Non-GAAP general and administrative expenses
244,518
274,415
676,914
877,334
Operating costs and expenses
1,255,861
1,139,322
3,291,460
4,479,950
Share-based compensation expense in operating costs and expenses
54,035
40,818
124,607
174,697
Non-GAAP operating costs and expenses
1,201,826
1,098,504
3,166,853
4,305,253
Loss from operations
(127,389)
(108,429)
(141,014)
(615,160)
Share based compensation expenses
54,035
40,818
124,607
174,697
Non-GAAP loss from operations
(73,354)
(67,611)
(16,407)
(440,463)
Net (loss)/income attributable to TAL Education Group
(43,608)
(99,368)
53,012
(1,027,992)
Share based compensation expenses
54,035
40,818
124,607
174,697
Non-GAAP net income/(loss) attributable to TAL Education Group
$ 10,427
$ (58,550)
$ 177,619
$ (853,295)
Net (loss)/income per ADS
Basic
$ (0.07)
$ (0.15)
$ 0.09
$ (1.60)
Diluted
(0.07)
(0.15)
0.08
(1.60)
Non-GAAP Net income/(loss) per ADS
Basic
$ 0.02
$ (0.09)
$ 0.29
$ (1.33)
Diluted
0.02
(0.09)
0.28
(1.33)
ADSs used in calculating net (loss)/income per ADS
Basic
606,119,253
644,017,872
602,360,433
643,858,953
Diluted
606,119,253
644,017,872
626,130,648
643,858,953
ADSs used in calculating Non-GAAP income/(loss) per ADS